Canadian Canola Market Explorer
Overview
The Canadian Canola Market Explorer is an independent portfolio and demonstration project that brings several dimensions of the Canadian canola market into one place.
It brings recurring public datasets into a clear, responsive interface for people who want to explore the market without piecing together separate sources and static tables.
The challenge
Canadian canola information is available through multiple public datasets, but understanding production, prices, and trade together means moving between sources, formats, and reporting conventions.
The product needed to preserve the detail behind the data while creating a coherent path for quick questions, deeper exploration, and smaller screens.
The approach
The interface brings production, prices, and trade into a coherent experience with dedicated views for each subject.
- Organize the dataPresent public datasets in consistent formats that can be explored together.
- Connect the subjectsBring Production, Prices, and Trade into one navigable experience.
- Design for explorationUse interactive charts and maps to support comparison and discovery.
- Keep the detail availablePair charts and maps with explanatory text.
- Support different screensUse layouts that adapt navigation, controls, and graphics to smaller screens.
- Keep sources visibleLink the public data sources so visitors can review what underlies the views.
The product
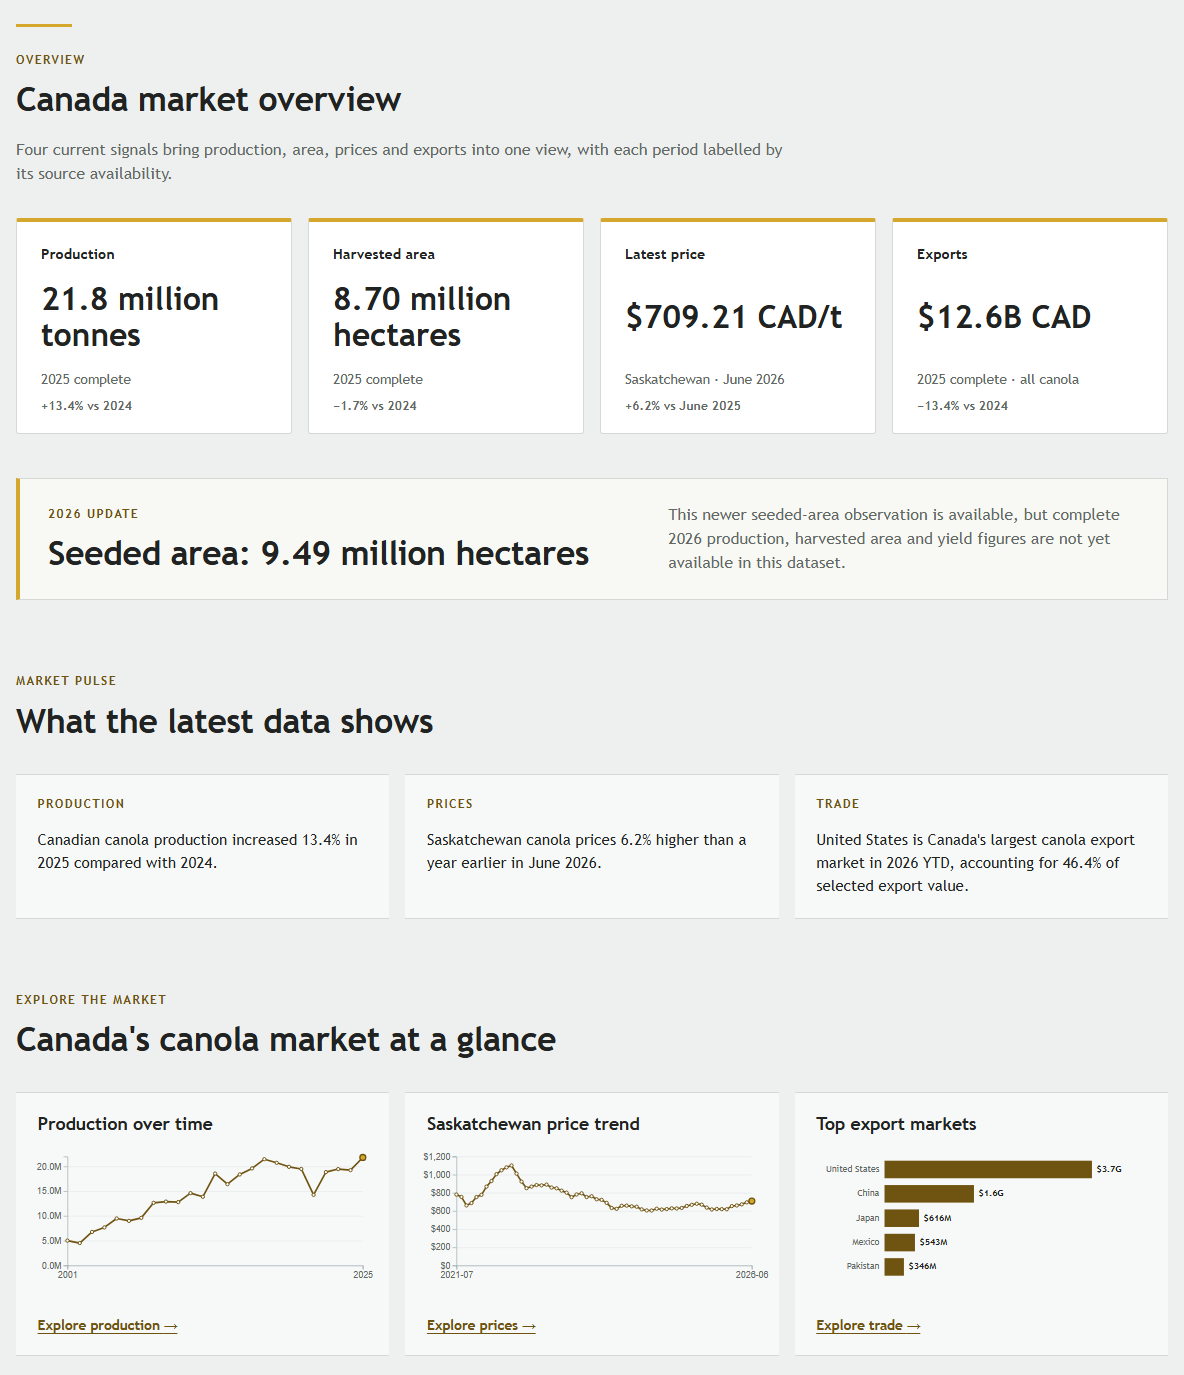
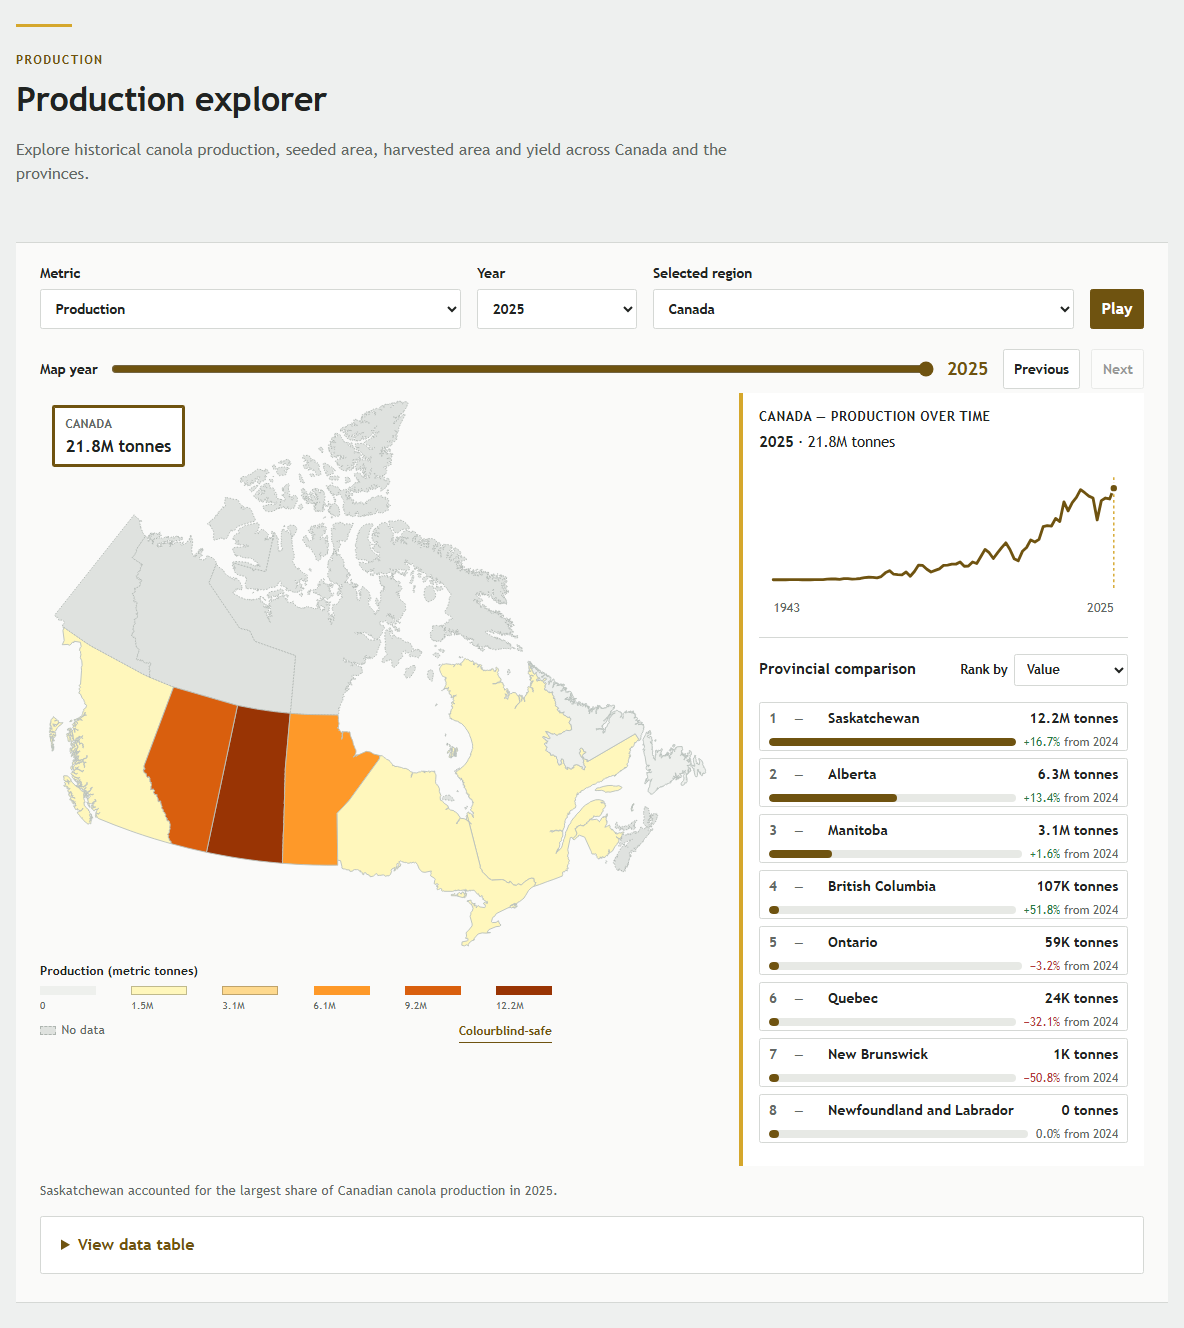
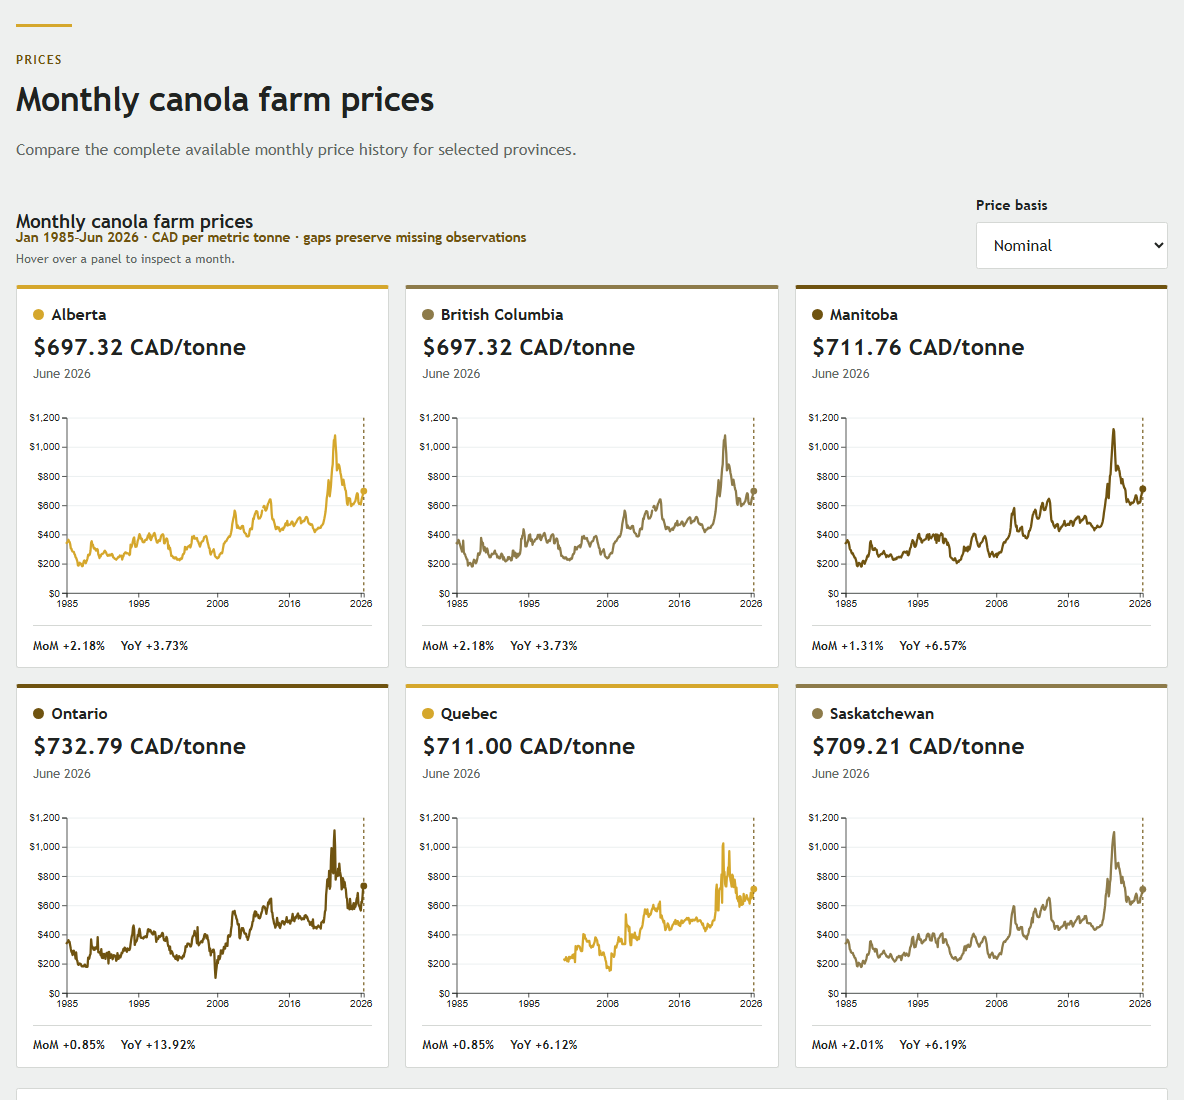
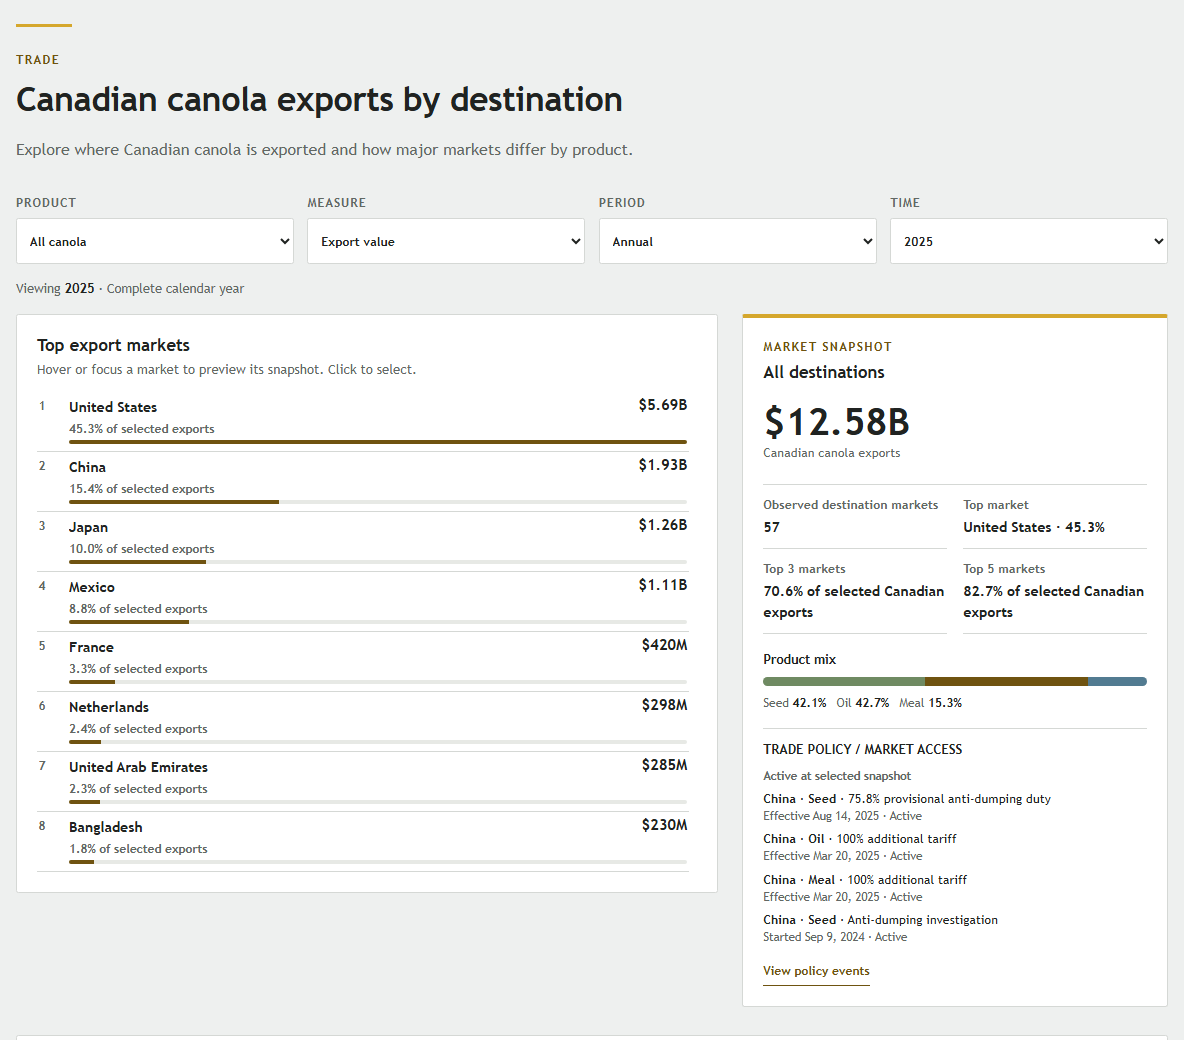
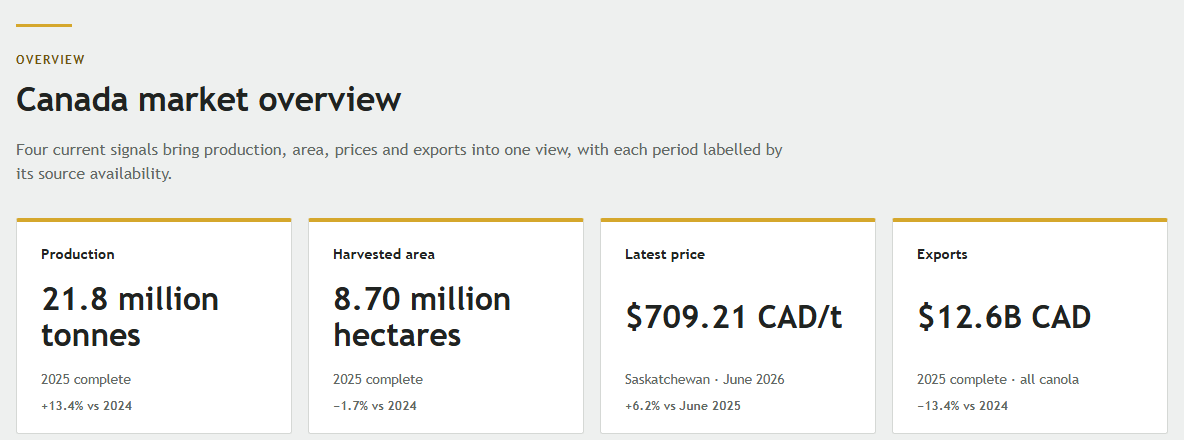
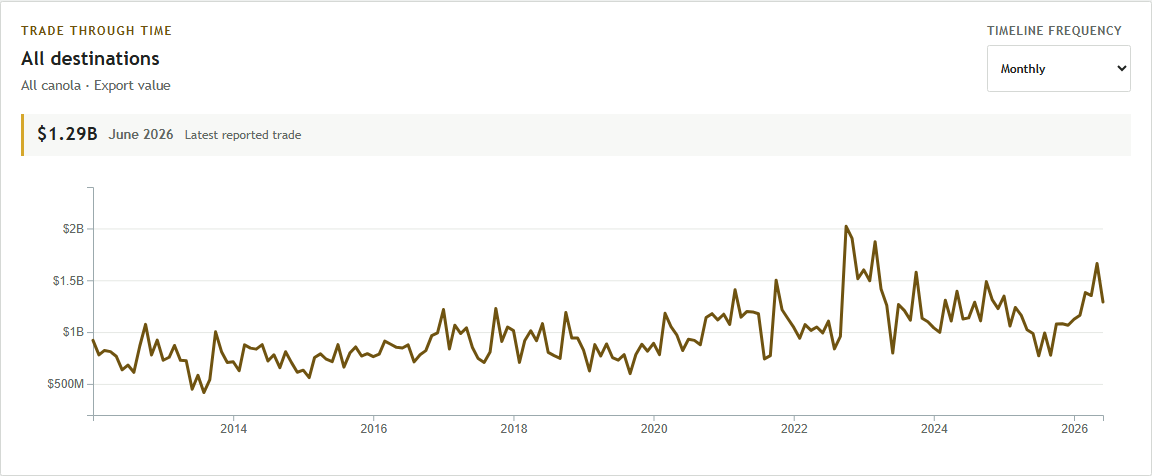
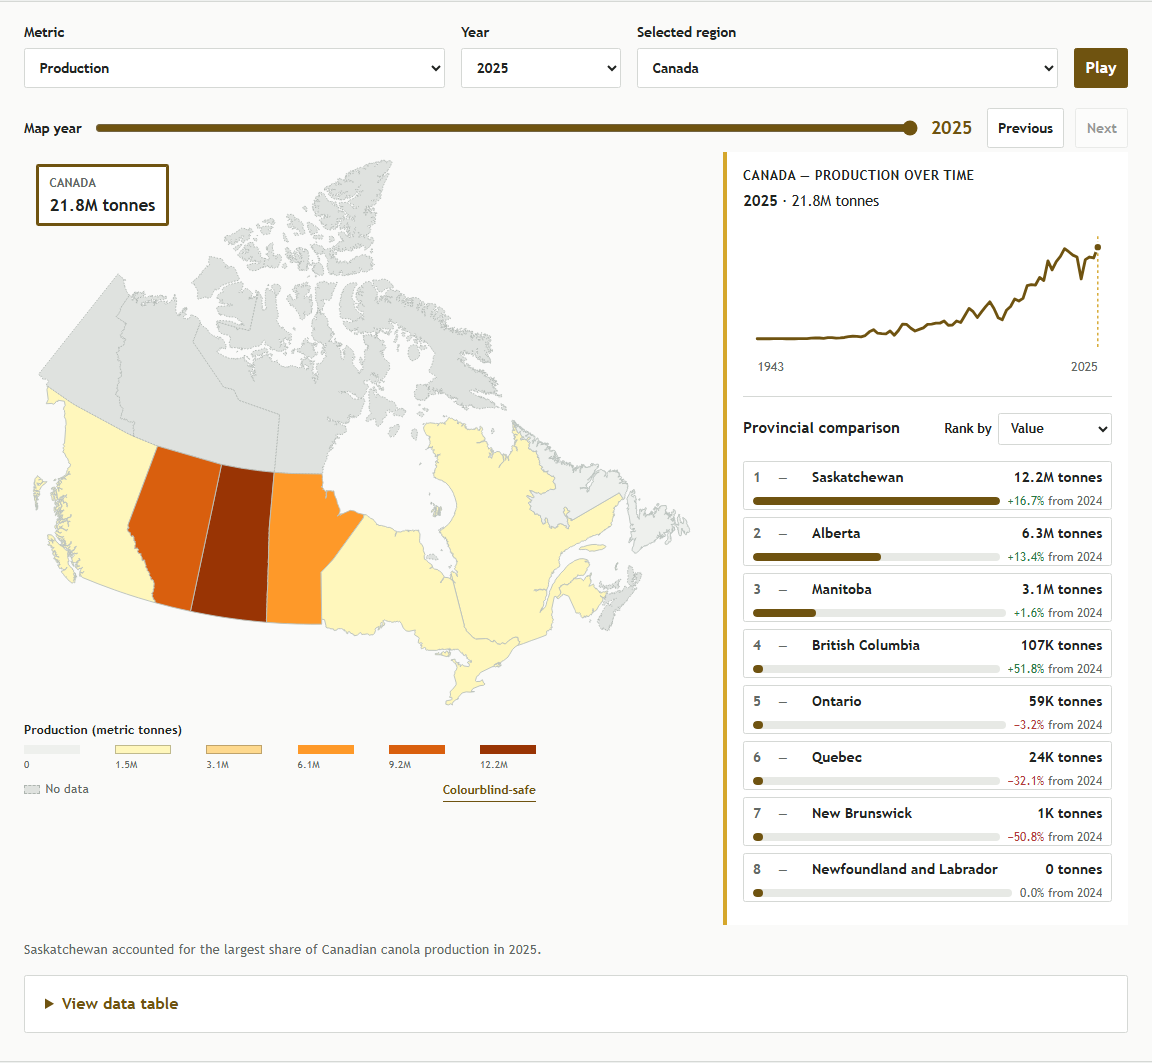
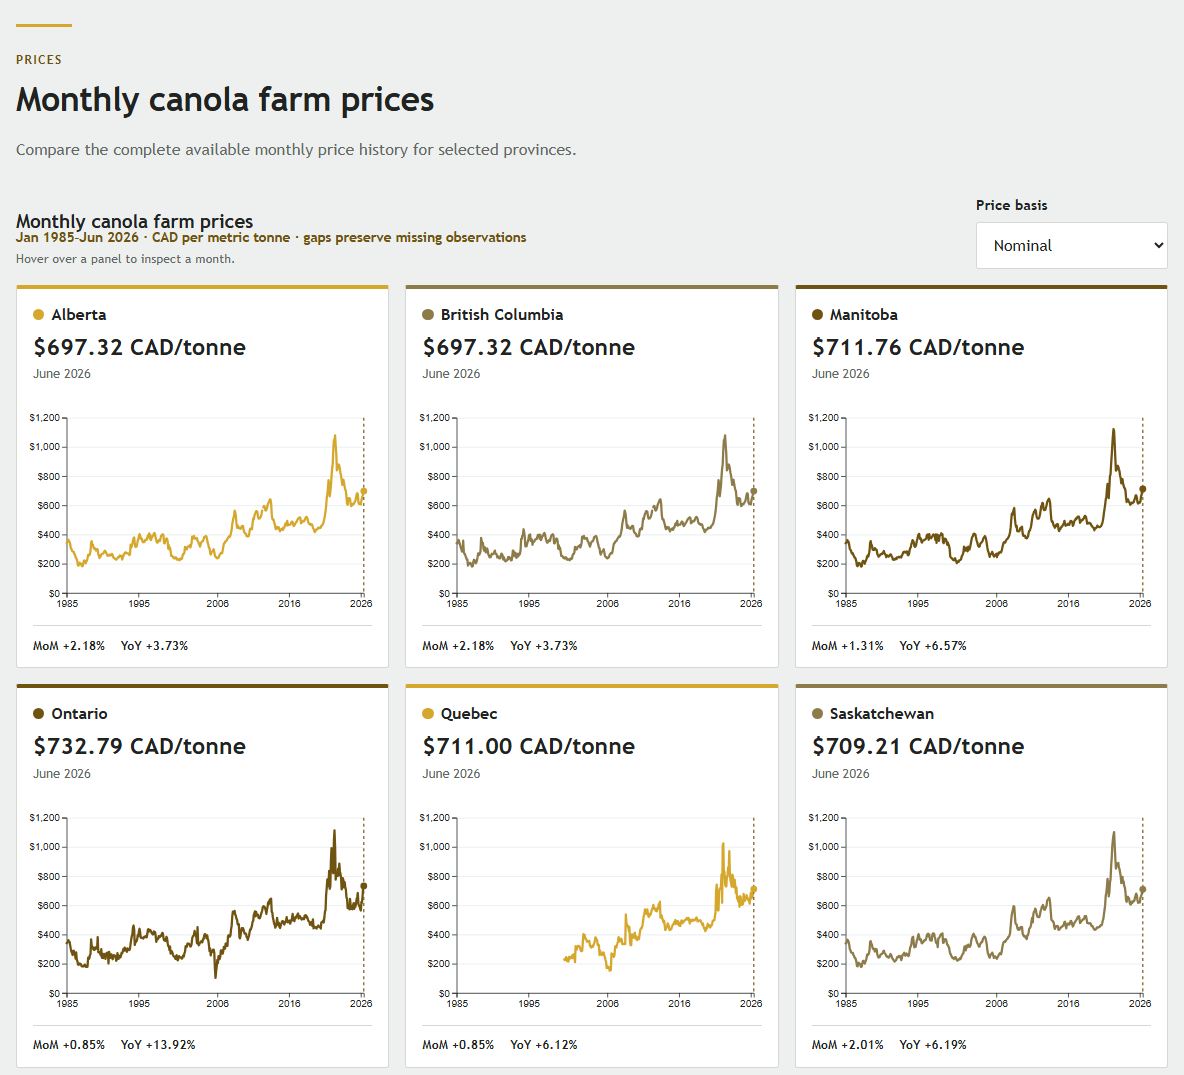
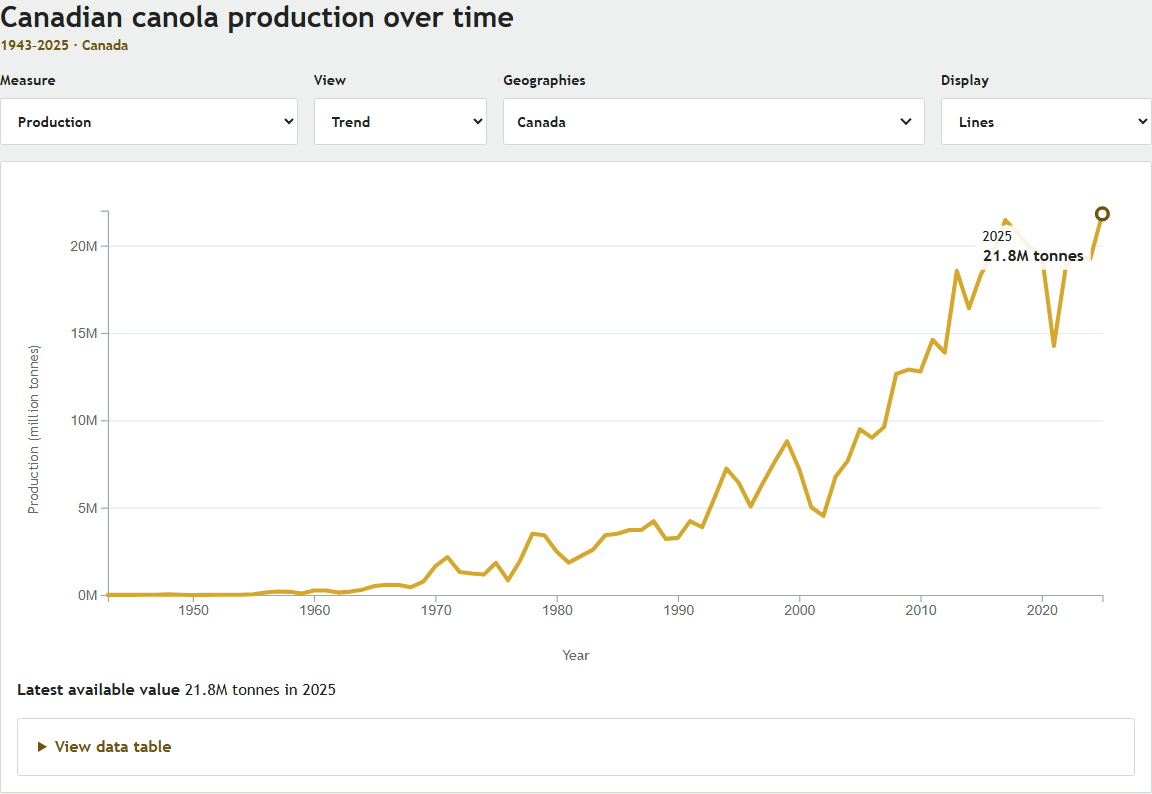
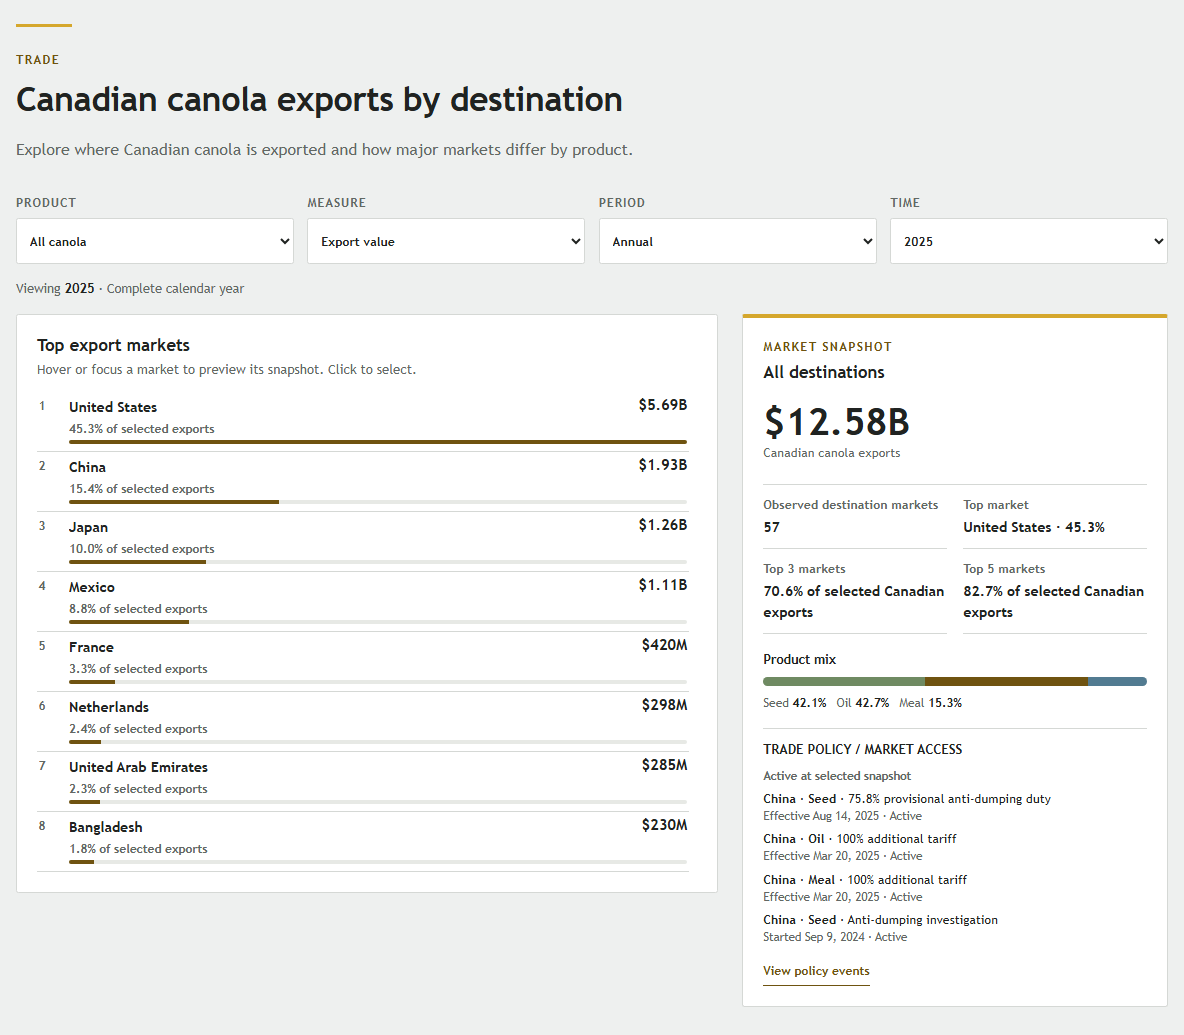
The product combines an overall market view with dedicated sections for production, prices and trade.
These screenshots are snapshots; the live Explorer may show newer observations.
Data & methodology
The Explorer presents production, price, and trade data in interactive views. The Statistics Canada sources cited below provide the public data for these subjects.
The result is an interactive way to explore the selected datasets rather than a one-off static visualization.
- Production. Annual production, seeded area, harvested area, and yield come from Statistics Canada table 32-10-0359-01 (opens in a new tab).
- Prices. Monthly canola farm prices come from Statistics Canada table 32-10-0077-01 (opens in a new tab).
- Inflation adjustment. The Explorer calculates inflation-adjusted canola farm prices using Canada’s monthly, not seasonally adjusted All-items Consumer Price Index from Statistics Canada table 18-10-0004-01 (opens in a new tab). The adjusted prices are expressed in June 2026 dollars.
- Trade. Export records come from Statistics Canada’s Canadian International Merchandise Trade (CIMT) Web Application (opens in a new tab).
These are data sources for an independent project; citing them does not imply their endorsement.
Accessibility & responsive design
The Explorer is designed for different screen sizes, with controls and charts for comparing data. This case study includes text descriptions of the pictured views and links to the public data sources.
Technology
A focused front-end stack supports the product without becoming the story.
- HTML
- CSS
- JavaScript modules
- D3.js
- Vite (build tool)